 HOME
HOME
 Teletherm Infrared
 Systems/Research
________________________________________
25 years of providing clinical IR systems
Green technology for health imaging!
|
Images courtesy of Teletherm Infrared Systems/Research ________________________________________ 25 years of providing clinical IR systems Green technology for health imaging! |
| CONTACT US THERMAL IMAGERS TRAINING CLINICAL STUDIES VETERINARY SOFTWARE ACCESSORIES HISTORY ERGONOMICS INDUSTRIA |
ThermReview Software Designed for Clinical Infrared Thermal Imaging Windows 7 Compatible Powerful Image Post-processing Available for Teletherm T4 Infrared Imager |
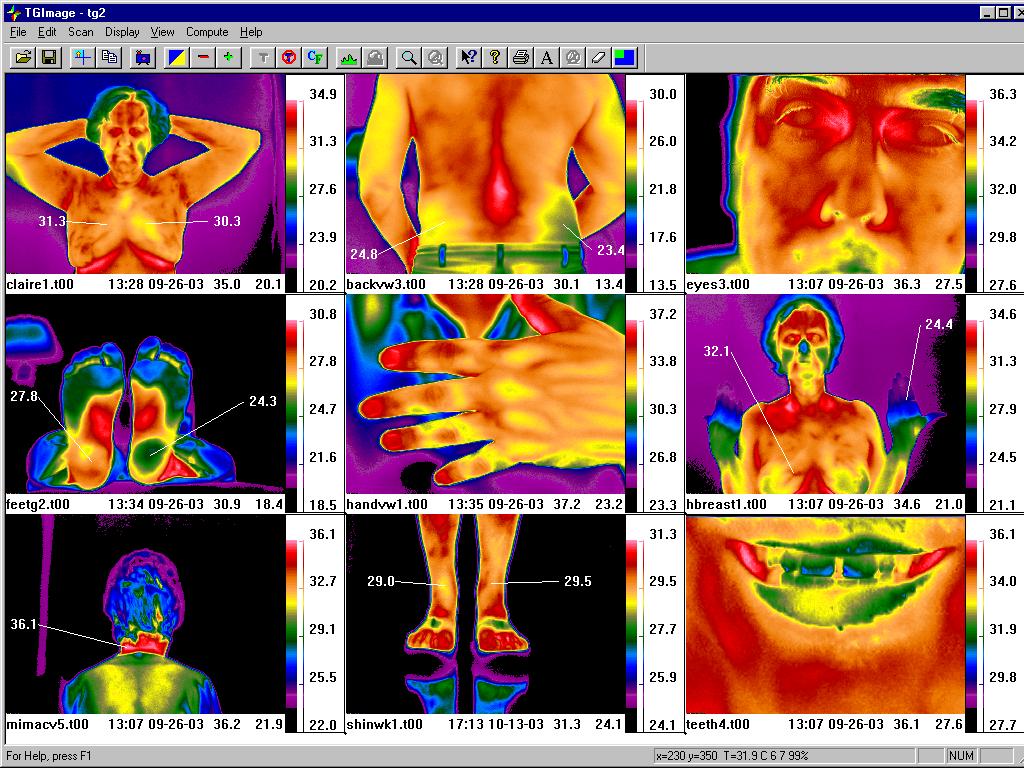 |
FEATURES 9 images can be displayed in a single window, simultaneously. Place temperature markers with pointers at any user selected angles and distance. Place temperatures at any pixel location on the images. Move to any image and show appropriate temperatures for that image. Icons at top of screen provide for easy function control. Temperature values appear beside the color bar, and show increments of temperature. Name of image, date, time and temperature range stamp at bottom of each image. |
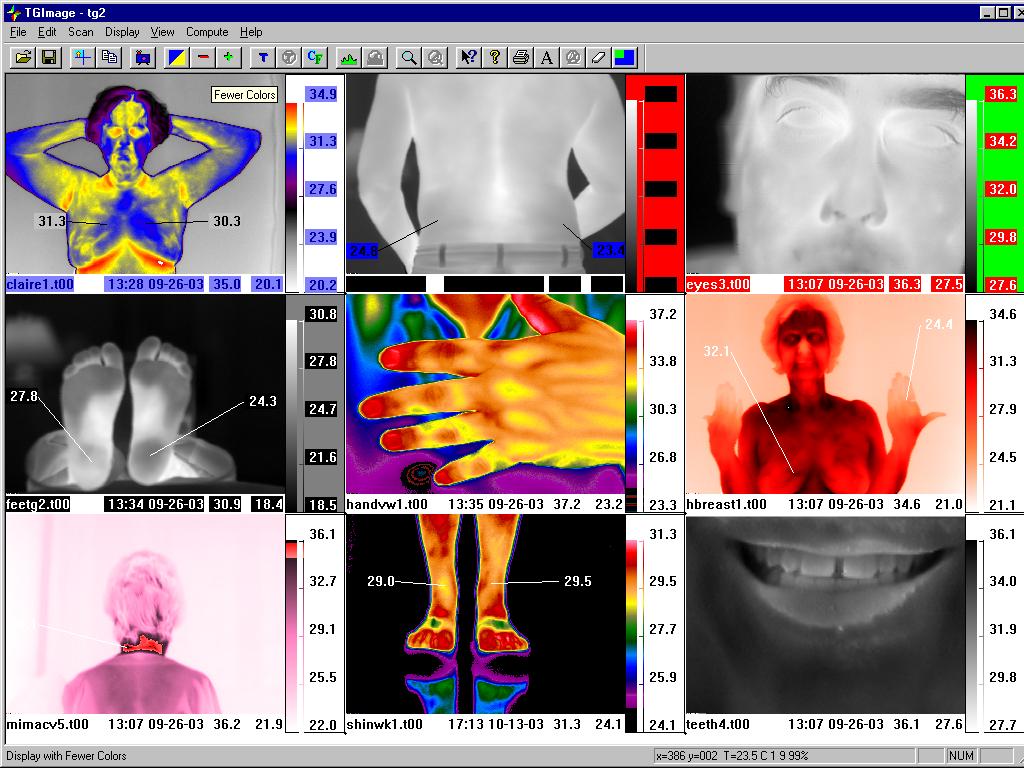 |
PALETTE OPTIONS The powerful use of varying palette formats using the same images as displayed above. Palette Design Tool allows for any palette to be designed with any combination of colors. Note use of black to white, or the inverse, as demonstrated on the mouth image at the bottom right. Image at bottom left utilizes shades of pink and white with red isotherm used for hot area in the cervical region. X/Y axis coordinates and specific temperature value for any location on any individual image appears in bar at bottom of window view. |
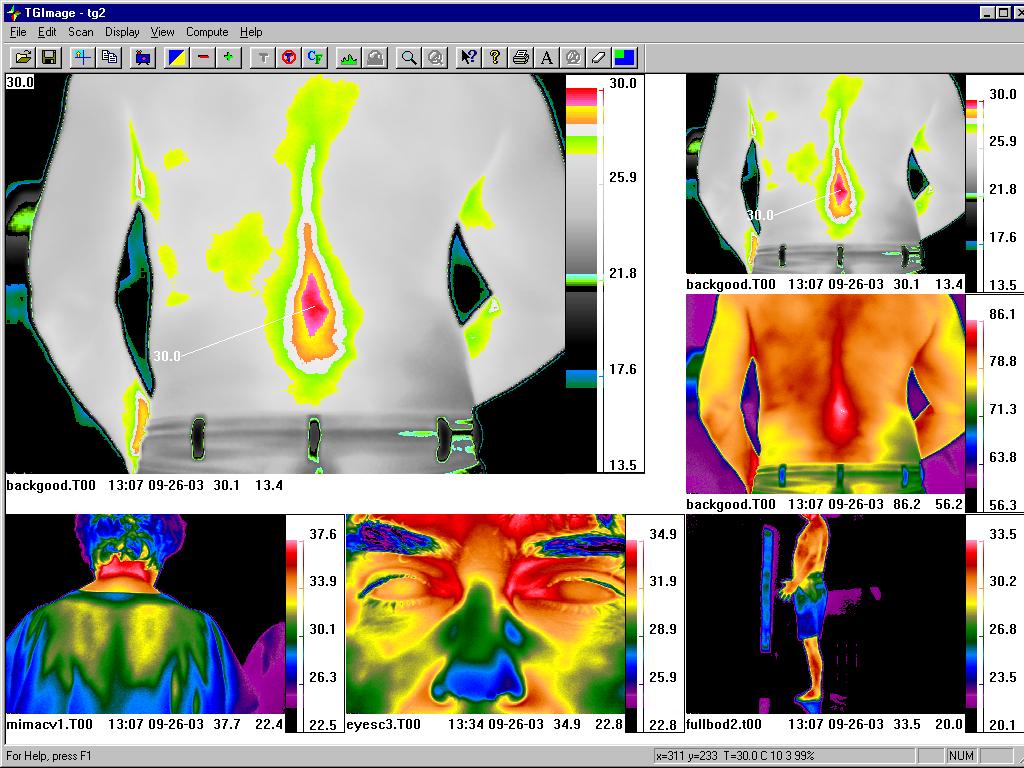 |
MULTIPLE ISOTHERMS View of subject's back image demonstrating multiple isotherm areas, or highlighted similar temperature zones, overlaying shades of grey. Upper left hand corner of larger image shows temperature value for cursor location on specific pixel within the image. This automatically changes as the mouse is moved across the image. |
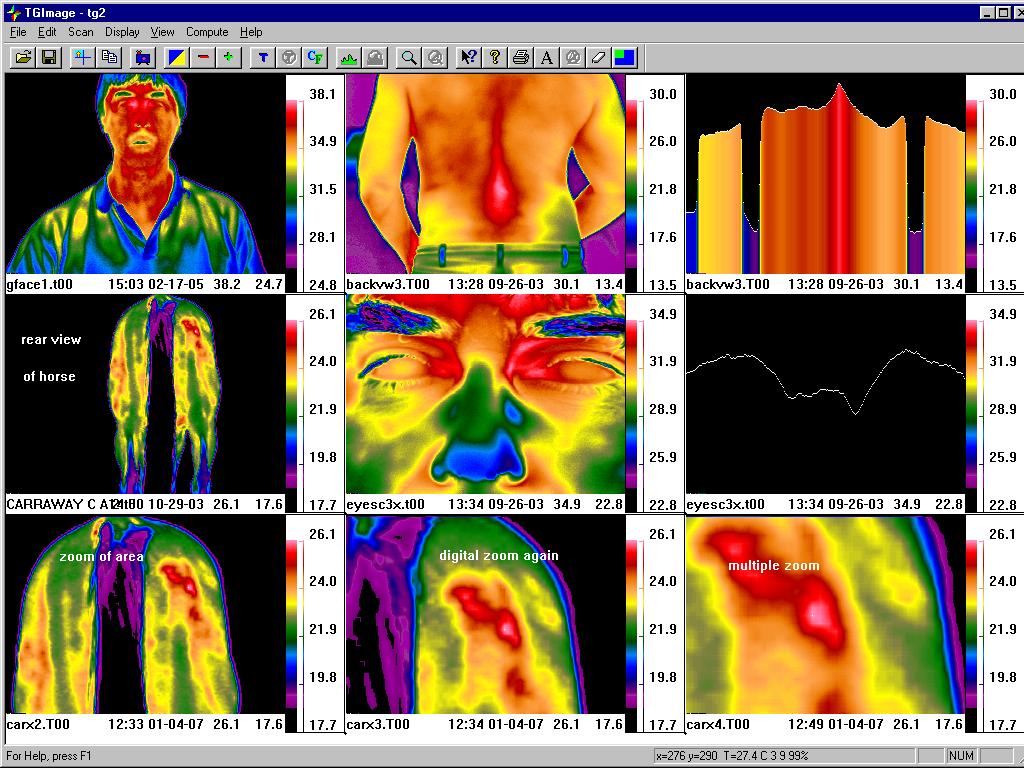 |
GRAPHS Note use of graphing function for both bar and line graphs. These can be positioned for any vertical or horizontal location on a selected image. Image on left at the middle position is a rear view of a horse with a muscle problem. The bottom three images are of the original image, but shown using the digital zoom function on the software, with multiple enlargements of the area of interest. |
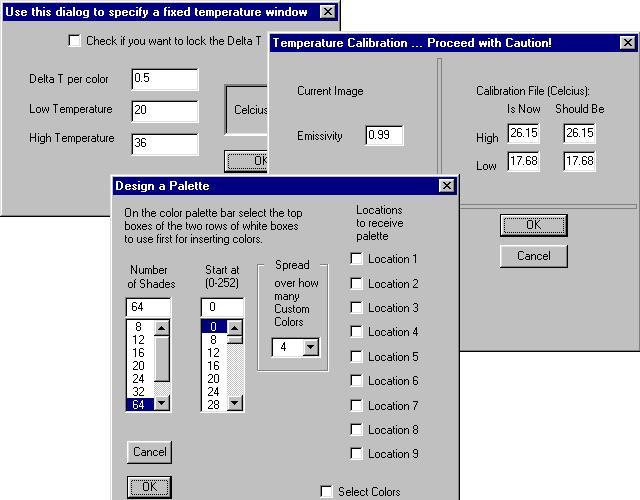 |
POST-PROCESSING Function for re-processing any saved image with fixed temperature values and a set Delta T (temperature differential) per color. Ability to control master temperature calibration in the field for taking of images. Design options for multiple palettes and isotherms for any image location on the screen. |
|
|